CD Metrology and Scatterometry:
Line Gratings
Spatial Mapping of Critical Dimension
The ability to maintain the structural uniformity across the fabricated gratings is an important aspect to achieve high production yield. Therefore, dense spatial scans and mapping the variations of gratings' geometrical parameters are crucial.
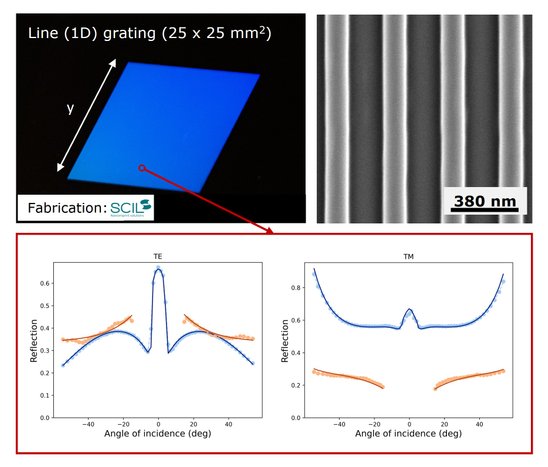
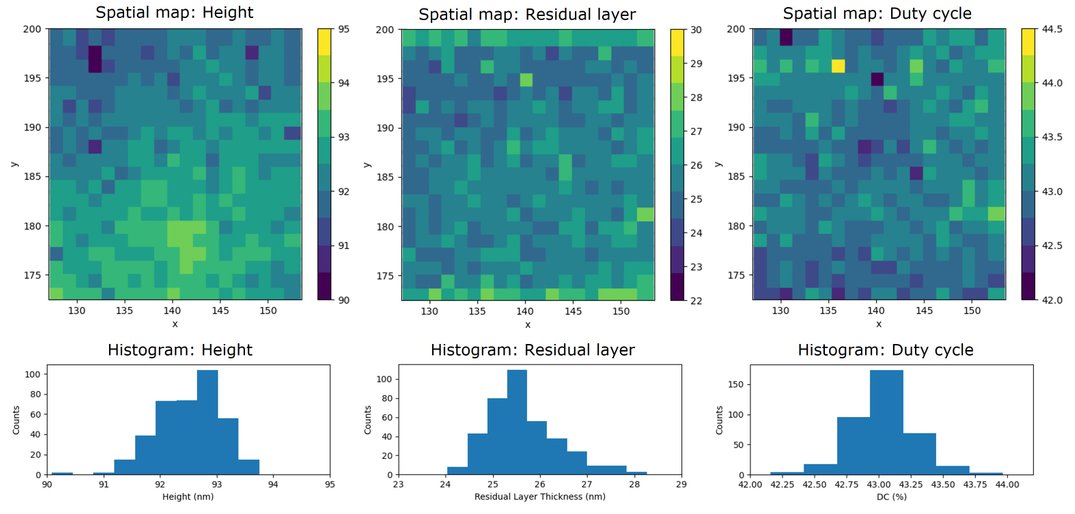
In this example, we illustrate how using LabScatter, we can investigate the spatial variations of parameters such as height, residual layer thickness, and duty cycle over a large area grating. Here, the measurements are carried out on a line grating (one-dimensional) fabricated using substrate conformal imprint lithography. The measurement (dots) and the fitted model (lines) are shown for a single position on the grating. The measurements are repeated over 400 points across the 25 x 25 mm2 area and each measured point is fitted with the appropriate model. The extracted geometrical parameters are plotted in a colormap as a function of the position on the sample.
It can be seen how, for instance, height varies by 4 nm from the top to the bottom of the grating patch, while other parameters such as residual layer
thickness and duty cycle remain constant. In addition, due to the large number of measurements that are carried out during the spatial scans, we can investigate statistical distributions of such geometrical parameters, which is not possible using conventional methods such as scanning electron microscopy and atomic force microscopy.


